TOP FEATURES - UPTIME CHECKS
We monitor your website and servers - by looking for certain text in a normal webpage or connecting to a public port over the Internet.
Our most important function is the alert you will get by email and/or text. Here you have some screenshots from our admin-panel.

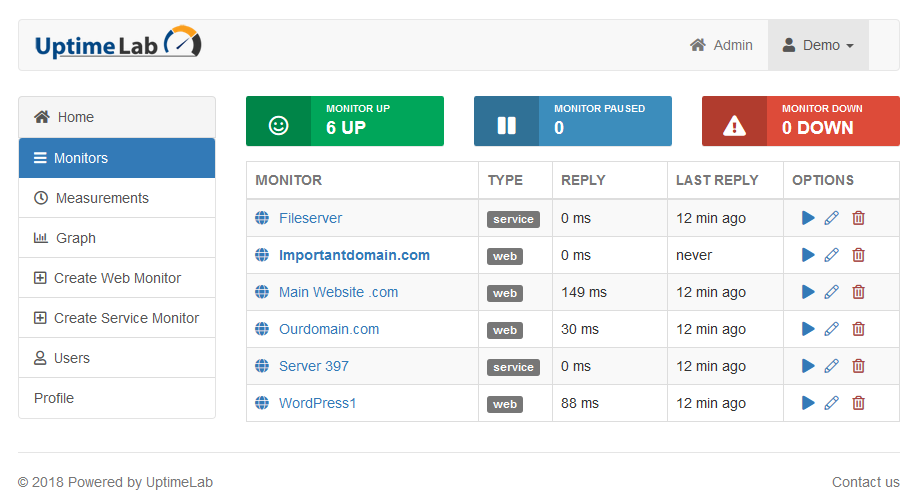
Main Screen
This is the main start page for seeing all checks/monitors. Fast and easy to see the last results of the checks.
Click on a Monitor reveals extra menu options like Measurements and Graphs.
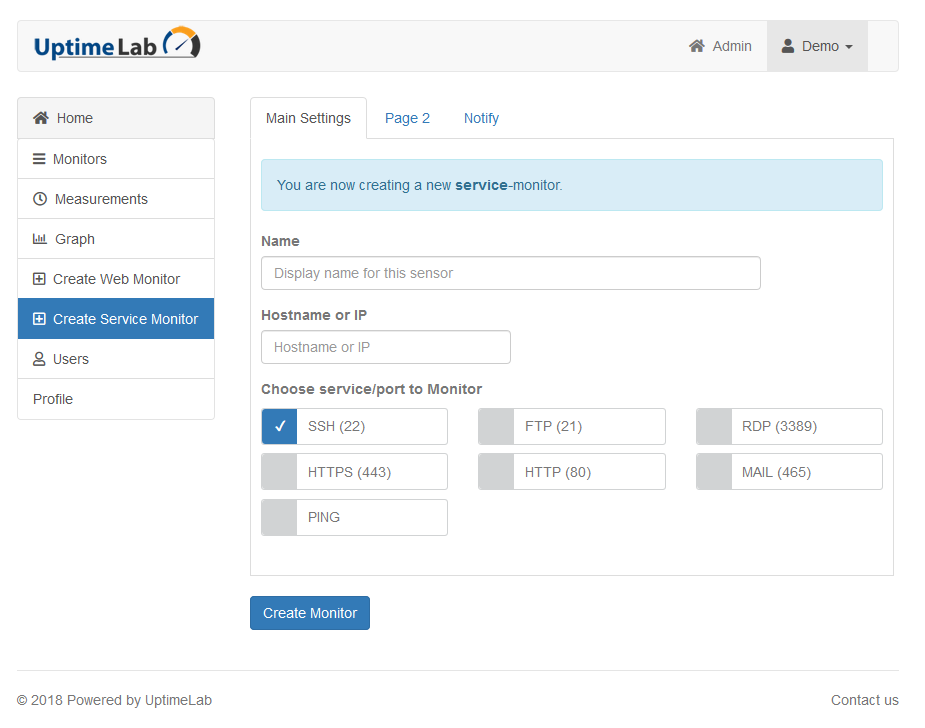
Add Service Monitor
Service Monitor is a port-monitor that checks ping and/or TCP-ports for connection issues. By using simple GUI, you can easly play around with the ports.
You can choose timeout-values.
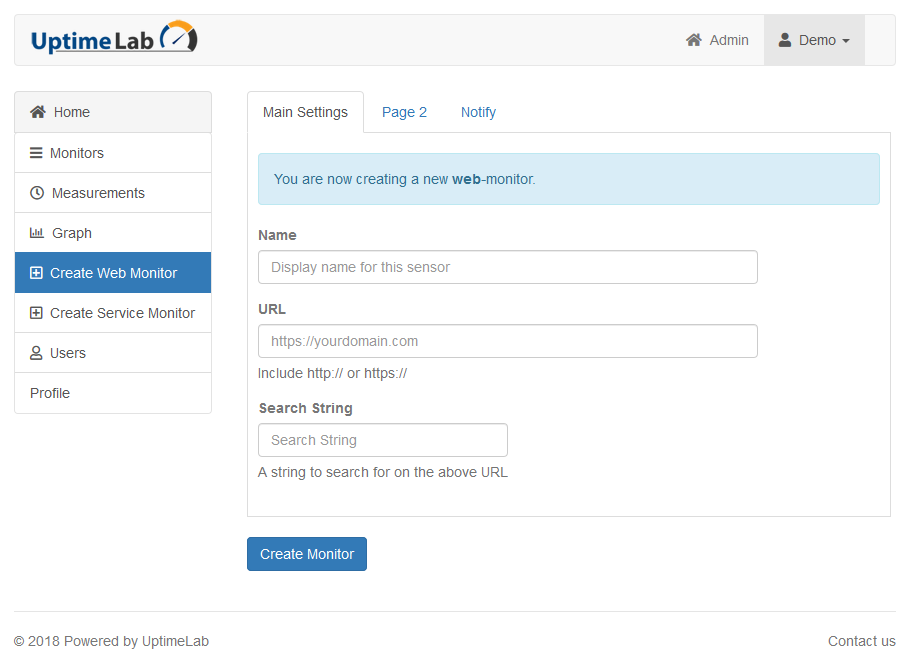
Add Web Check Monitor
Enter a display-name, an URL and searchstring - and the sensor is created. It now checks the WordPress-website or homepage for this word. If your website goes down, you will know it!
Notification per Monitor
You can create users from admin-area and attach as many as you want to each Monitor/Check. By default, the system select all your users and email/sms, but you can choose who to notify and by text or email.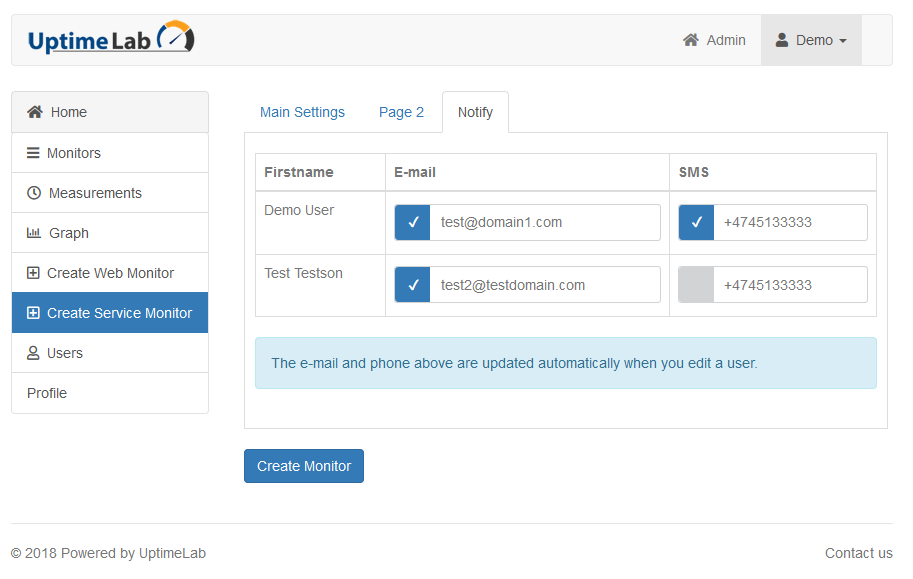
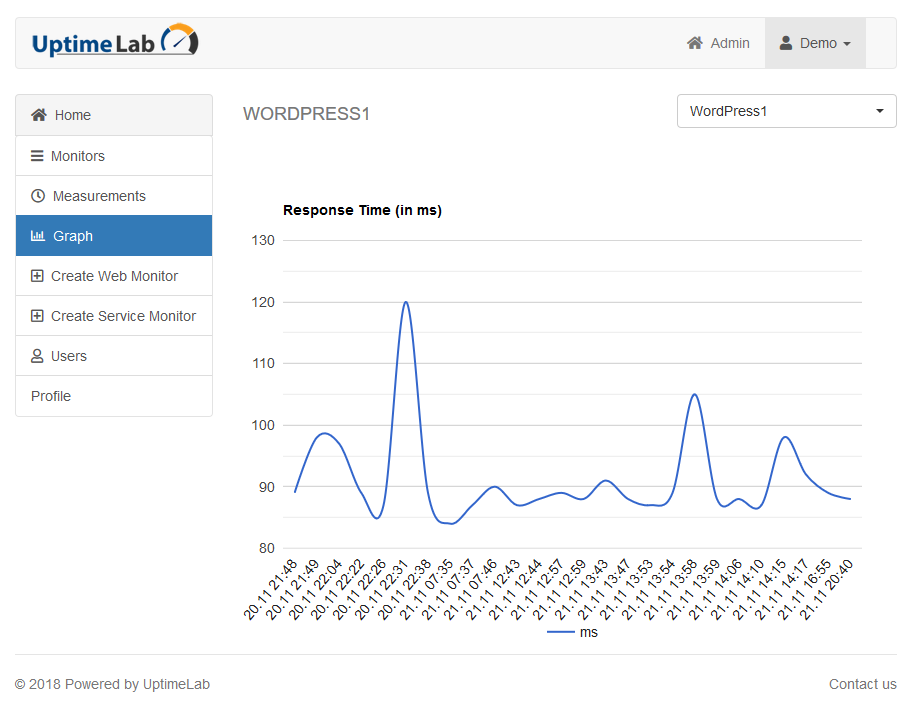
Graphical Result
We display and measure the reponse time of your webpage in a graph - you can switch fast from different monitors/checks by choosing the monitor-object in the dropdown above.